Abstract
Effective biotechnology training requires learners to connect conducting experiments with quantitative analytics, and to document decision-making in ways that support reproducibility and collaboration. In many learning contexts, however, instructional toolchains often separate course materials, laboratory documentation, and data analysis across different systems, making it difficult for both learners and educators to keep analytic decisions and interpretations traceable. This paper presents NexLAB, a web-based platform that integrates instructor-authored course materials, a Design–Build–Test (DBT) structured electronic laboratory notebook (ELN), a course-grounded AI tutor, and embedded machine-learning analyses within a single workflow. We developed cancer-research-focused courses within NexLAB and demonstrated the workflow using the Breast Cancer Wisconsin (Diagnostic) dataset. We report the results as reproducible instructional examples, running the models with fixed split/seed settings to show how feature representation affects classification error patterns and how predictor choice influences regression performance and cross-validation stability. This manuscript’s supporting evidence is reported at the artifact-level, rather than at the level of learner outcome gains, and it synthesizes design requirements for teaching effective quantitative interpretation, experimental revision, and reproducibility.
Keywords: Electronic Laboratory Notebook (ELN), biotechnology education, machine learning instruction, interpretability, AI tutoring, Design–Build–Test (DBT), data literacy, workforce development.
© 2026 under the terms of the J ATE Open Access Publishing Agreement
Introduction
Workforce-aligned biotechnology education—including the two-year and technician-training programs central to community college instruction—combines hands-on experimental practice with quantitative analytics: documenting and justifying analytic decisions, interpreting metrics, and understanding error tradeoffs (e.g., false negatives vs. false positives). These competencies extend beyond conceptual biology to include selecting valid metrics, drawing inferences from model outputs, and recognizing limitations [1]. Yet while learning content is delivered in a learning management system, notebook documentation and data analysis often occur in separate environments (e.g., spreadsheets, code notebooks). Teaching these skills in such a fragmented way raises cognitive and logistical barriers and can undermine reproducibility [2]. Evidence on active learning in STEM instead favors designs that integrate analysis, iteration, and reflection into one workflow [3], helping learners link methodological choices to outcomes.
Electronic Laboratory Notebooks (ELNs) offer a way to create structured documentation by organizing scientific decisions, methods, results, and interpretations. Prior studies show that ELNs can strengthen record-keeping and reproducibility, especially when combined with clear guidelines, training, and review practices [4],[5],[6]. In an educational context, ELNs have been associated with improved organization and accessibility to student work, allowing instructors to assess the underlying learning process rather than only final outputs [7],[8]. However, ELNs alone do not ensure that learners can successfully perform quantitative analyses, select appropriate metrics, or connect analytic outputs back to documented reasoning. This gap motivates the integration of instructor support and feedback systems that align with the learning content, such as AI tutors, and encourages course reflection rather than just providing answers [9],[10]. As AI-trained tutoring becomes more available, an important question is how tutoring, documentation, and analysis can be combined in ways that support learning while keeping modeling choices and interpretations clear, reviewable, and reproducible.
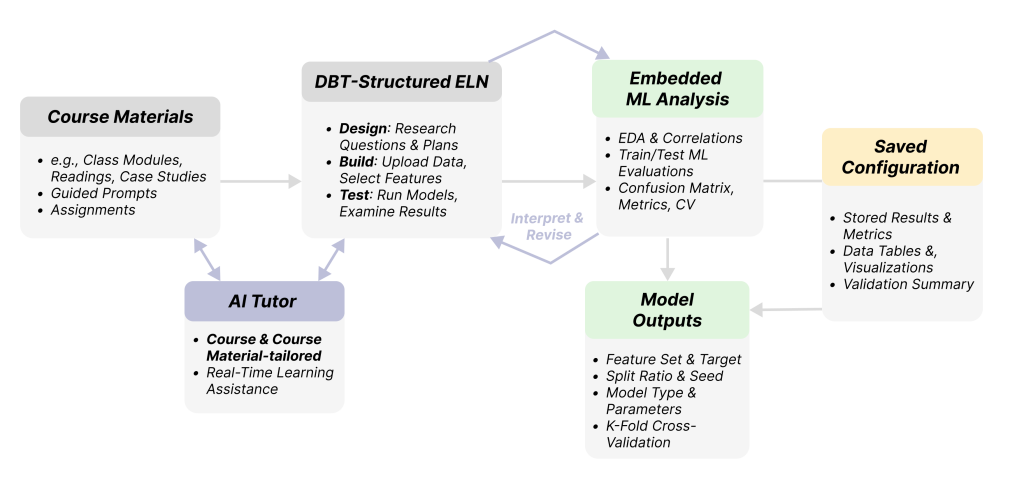
In this paper, we present NexLAB, a web-based platform that brings instructor-authored course materials, a structured ELN, a course-grounded AI tutor, and optional embedded analysis tools into one environment. Its ELN is organized around a Design–Build–Test (DBT) scaffold, consistent with iterative workflows in modern biomanufacturing [11],[12], and it saves analysis configurations so that runs are reproducible and comparable. The following section describes how the platform is used in a course; to make its analytic workflow concrete, Methods and Results sections demonstrate it using the Breast Cancer Wisconsin (Diagnostic) dataset (BCWD) in a classification and regression contexts [13]. Figure 1 summarizes the integrated workflow.
NexLAB in the Classroom
NexLAB is an integrated web-based course management platform for biotechnology education. At its core, it combines instructor-authored course materials, a structured electronic laboratory notebook (ELN) organized around a Design–Build–Test (DBT) cycle, and a course-grounded AI tutor. Embedded statistical and machine-learning (ML) tools are an optional layer that an instructor can draw on when a course involves data analysis, thereby extending ELN capabilities. A course in NexLAB can therefore be about almost any biotechnology topic and can use the ELN and AI tutor with little or no quantitative modeling. The data-analysis tools become central only when the subject matter calls for them, as in a diagnostics or data-science course.
Intended Students, Instructors, and Prerequisites
NexLAB is designed for community college and lower-division undergraduate students in biotechnology and related programs. Using the platform itself—reading course materials, keeping an ELN, asking the AI tutor questions, and uploading data—requires no statistics or programming background from students or instructors. Prerequisites depend entirely on the course an instructor builds: a laboratory-documentation or microbiology course may require no quantitative background, whereas a course using the embedded analysis tools, such as the diagnostics example below, assumes only basic statistical literacy—familiarity with averages, variability, and correlation—and no calculus, formal statistical inference, or programming.
Technical and Teaching Expertise Required to Adopt NexLAB
NexLAB is available as a hosted instance accessed via a web browser, with course authoring, dataset upload, and analysis handled in the web interface, so adoption requires no local installation or server administration. An open-source version is available for institutions that prefer to self-host. The expertise an instructor needs likewise follows the course: a course without the analysis tools needs no special quantitative preparation, while a data-analysis course requires only working familiarity with the concepts it teaches—train/test evaluation, confusion matrices, precision and recall, and cross-validation—not machine-learning or programming, as the platform is designed to keep modeling choices simple and interpretation-focused (seeMethodological Constraints), with the AI tutor also reinforcing instructor-led teaching.
A Worked Course Example: Medical Biology I and II
To demonstrate how NexLAB fits into a curriculum, we describe two courses authored in the platform and designed to be taught together: Medical Biology I: Foundations of Cancer Biology and Medical Biology II: Breast Cancer Diagnostics, Data Science, and Machine Learning.
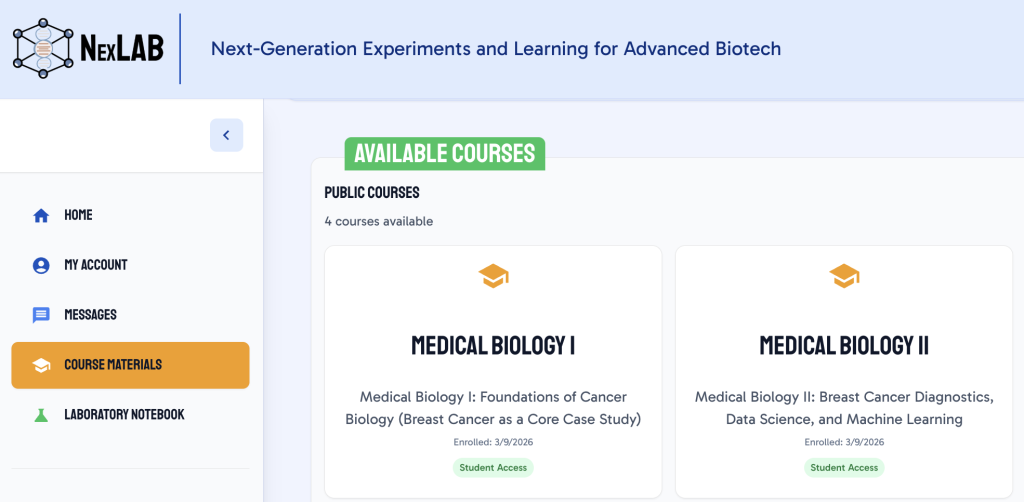
The first is conceptual: it builds the required biological knowledge—cell-cycle control, genomic instability, breast-cancer subtypes, and the biological basis of diagnostics—and uses the ELN and AI tutor for reading, documentation, and exploration of conceptual questions. The second is applied: it reuses the same breast-cancer case to teach how biological measurements become diagnostic datasets and how models are interpreted and validated, and this is where the embedded analysis tools come in. Taught in sequence, the courses move from biological mechanisms (Course I) to data-driven diagnostic reasoning (Course II) within one example case study. We present these as illustrative modules—authored in NexLAB but not yet taught to students—so the description below reflects intended use rather than an evaluated classroom implementation (Figure 2).
Table 1. Unit structure of the two courses
| Unit | Medical Biology I: Foundations of Cancer Biology | Medical Biology II: Breast Cancer Diagnostics, Data Science, and Machine Learning |
| Overview | Course Overview | Course Overview and Syllabus |
| Unit 1 | Cancer as a Biological Problem | From Cells to Data |
| Unit 2 | Epidemiology and Risk | Exploring Diagnostic Datasets |
| Unit 3 | Molecular Genetics of Cancer | Introduction to Machine Learning in Medicine |
| Unit 4 | Breast Cancer Subtypes | Diagnostic Models |
| Unit 5 | Tumor Heterogeneity and Microenvironment | Evaluating Diagnostic Performance |
| Unit 6 | Cancer Diagnostics | Explainability and Trust |
| Unit 7 | Therapeutic Strategies in Breast Cancer | Ethics, Bias, and Equity |
| Unit 8 | Ethics, Equity, and Access in Cancer Biology | Future Directions in Cancer Diagnostics |
| Assessment | Breast Cancer Case Study, Final Exam | Capstone Case Study, Poster Presentation |
Medical Biology I builds biological foundations, while Medical Biology II applies them to diagnostics, data science, and machine-learning, where NexLAB’s embedded analysis tools are used.
How a data-analysis unit runs (Medical Biology II)
Medical Biology II progresses through eight units (Table 1), from raw measurements to diagnostic modeling, evaluation, explainability, and ethics. Within a modeling unit, the instructor frames the diagnostic question and the evaluation idea at stake—for example, why a false negative (a missed malignant case) matters more than overall accuracy. Students then work the Design–Build–Test cycle (see DBT-Aligned Student Activity Protocol): they state what they are predicting and how success is measured, run the model, and read the confusion matrix. Across units, they examine how different feature representations change these results—mirroring the classification and regression comparisons reported in the Results—and revise their approach, recording each decision in the ELN.
Anchoring question and assessment
The whole course is built around one research question—how an AI-based diagnostic model can be developed, evaluated, and effectively applied to support breast-cancer screening decisions—which students answer gradually as they interpret and compare model outcomes, weigh clinical tradeoffs, and make evidence-based decisions. As NexLAB saves each configuration with its results, the ELN shows how a student framed the question, chose and justified study metrics— providing evidence of their reasoning, not only final study outputs.
Using NexLAB with other curricula
Although this example centers on cancer diagnostics, the workflow is not specific to it: instructors author their own courses and upload their own datasets (see Data Ingestion and Management in NexLAB), so the same DBT-plus-analysis pattern can be re-grounded in a program’s own curriculum—e.g., bioinformatics, quality control, or a laboratory course using only the ELN and tutor.
Methods
Design and Scope
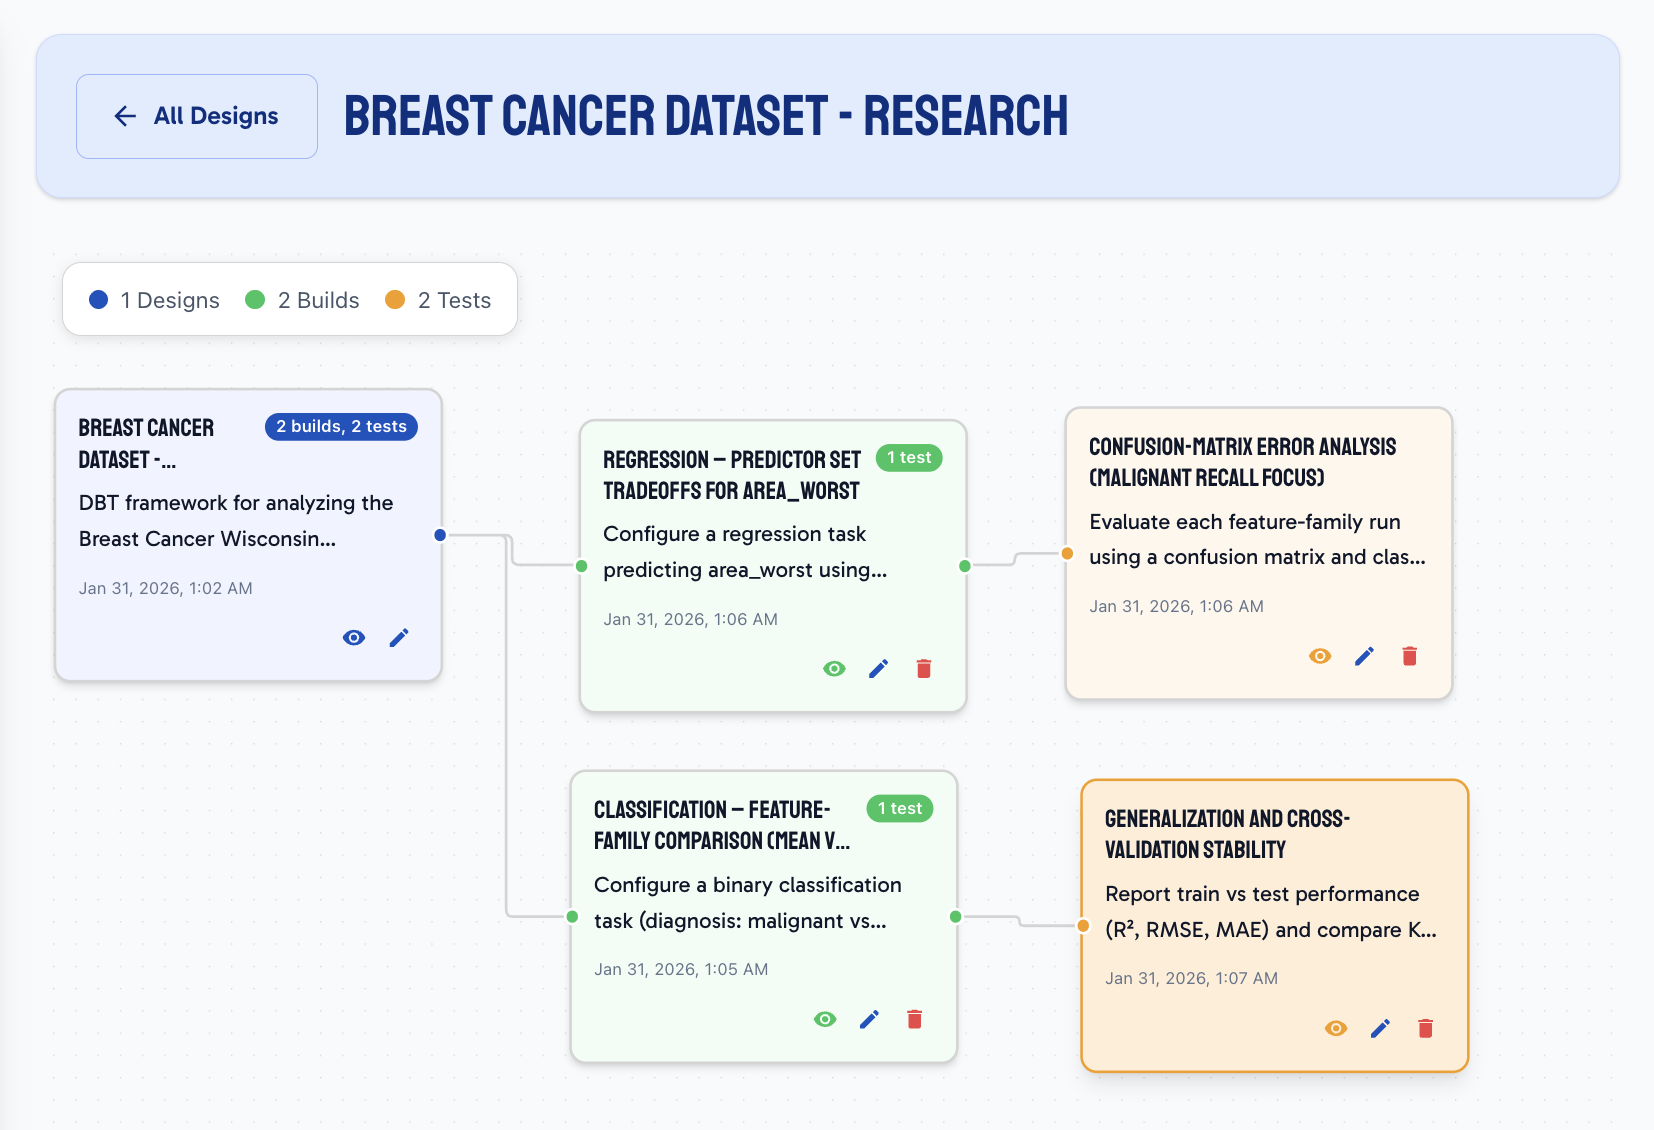
This study documents an end-to-end workflow in NexLAB, showing how the platform integrates three components in one environment: (1) instructor-authored course materials, (2) a structured ELN organized around a DBT scaffold (Figure 3), and (3) embedded statistical and machine-learning analyses. All quantitative results reported below were produced with NexLAB’s built-in analysis tools on the BCWD, a public benchmark dataset [13]. We use a de-identified public dataset and no student records or personally identifiable information; thus, the study does not constitute human-subjects research.
Platform Implementation and Analysis environment
NexLAB is an open-source, single-page web application hosted on GitHub. All analyses reported here run client-side in the browser, with model fitting, evaluation metrics, and visualizations generated in the NexLAB interface. Uploaded datasets are stored as raw CSV files in object storage, while a corresponding Cloud Firestore document holds the associated metadata and analysis outputs—schema, selected variables, model settings, and generated results [14]. Keeping data and configuration together lets any analysis be re-run under identical settings, supporting reproducible documentation within the ELN.
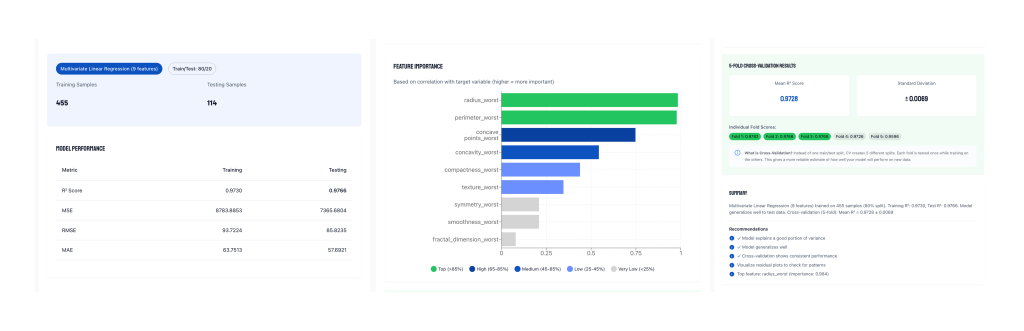
Figure 6 shows the learner-facing regression model outputs for the R3 configuration, including train/test metrics, an association-based ranking, and the cross-validation summary. The platform’s association ranking (absolute Pearson correlation with the target) highlighted radius_worst as the strongest correlate of area_worst (|r| = 0.984). This provides a straightforward interpretability cue for learners and supports discussion of redundancy and multicollinearity among geometric predictors.
Dataset
We used the Breast Cancer Wisconsin (Diagnostic) dataset (BCWD), which contains 569 cases and a binary diagnosis label (malignant vs. benign), obtained from the UCI Machine Learning Repository [13]. Each case includes 30 real-valued predictors computed from digitized images of fine-needle aspirates[13]. The predictors derive from 10 nucleus-morphology descriptors (radius, texture, perimeter, area,smoothness, compactness, concavity, concave points, symmetry, and fractal dimension), each summarized by three statistics—mean, standard error (SE), and worst (most extreme)—forming three parallel 10-feature families (30 predictors total).
Data Ingestion and Management in NexLAB
On upload, NexLAB parses each CSV in the browser using PapaParse [15], detects column types (numeric vs. text), and computes summary statistics (count, mean, median, standard deviation, range) before storing the file and metadata (see Platform Implementation and Analysis Environment).
Feature-Set Design
To keep comparisons interpretable and avoid ad hoc feature selection, we defined controlled feature sets that leverage the structure of the BCWD dataset (mean, SE, and worst feature families). Holding feature count and descriptor identity constant where possible lets us observe performance differences, attributed to how predictors summarize the underlying measurements rather than to changes in model capacity.
Classification (target: diagnosis)
We trained three parallel classification models, each using a complete 10-feature family: C1 (all *_mean predictors), C2 (all *_se predictors), and C3 (all *_worst predictors). Each family contains the same 10 morphology descriptors, so the only change across C1–C3 is the summary representation (mean vs.variability vs. extremes). Because each family contains the same 10 morphology descriptors, the only variable across C1–C3 is the summary representation (mean vs. variability vs. extremes).
Regression (target: area_worst)
We predicted area_worst from three predictor sets chosen to illustrate feature-selection tradeoffs and the effect of adding potentially redundant predictors: R1: radius_worst, perimeter_worst (2 predictors); R2: texture_worst, smoothness_worst, compactness_worst, concavity_worst, concave_points_worst, symmetry_worst, fractal_dimension_worst (7 predictors); R3: R2 plus radius_worst and perimeter_worst (9 predictors; excluding the target).
Analytic Procedures Executed in NexLAB
Exploratory Data Analysis (EDA).
We used two EDA routines to characterize each dataset and motivate feature-set discussions: (I) descriptive statistics for selected variables and a Pearson correlation matrix used to identify strongly correlated feature pairs and support discussion of redundancy and multicollinearity when interpreting linear models.
Classification (Binary Logistic Regression)
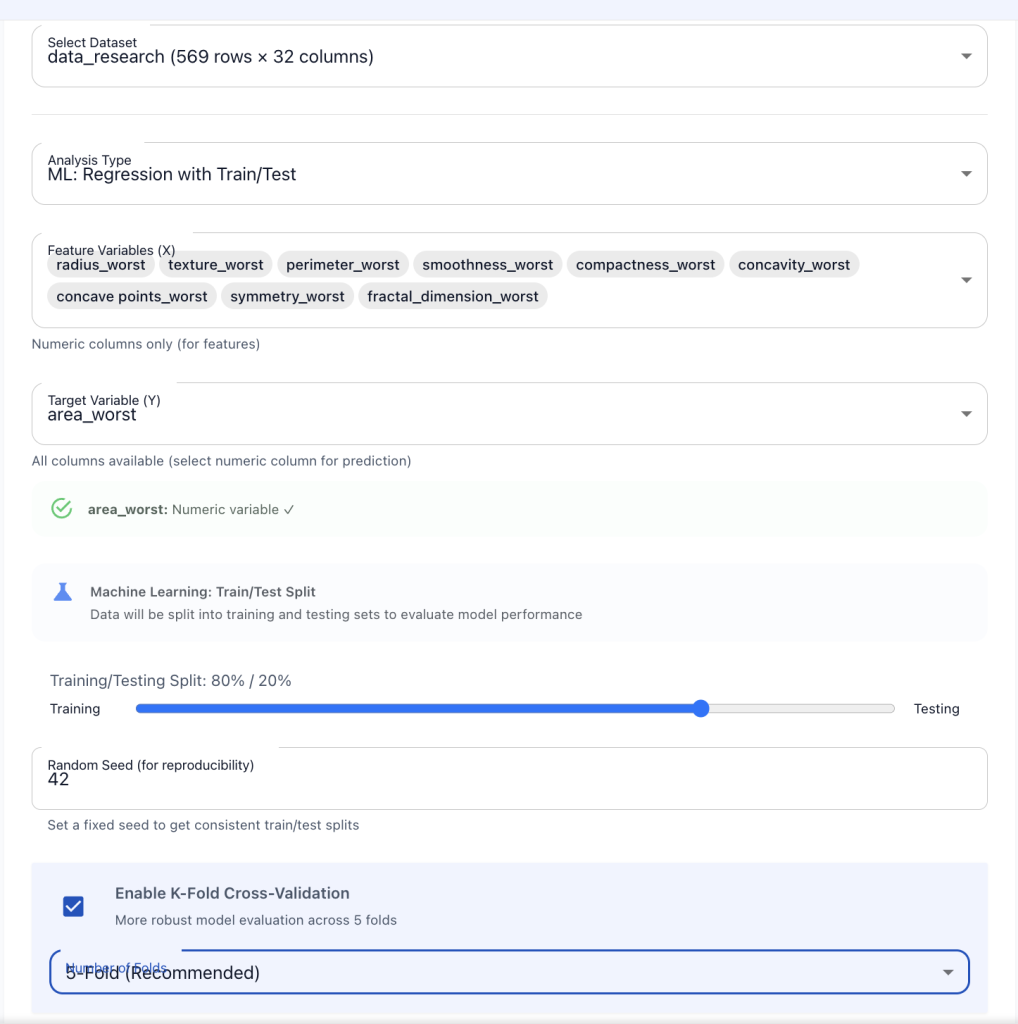
NexLAB trains a binary logistic regression model by gradient descent, with diagnosis as the target (malignant = 1, benign = 0). Data are split 80/20 into train and test sets using a fixed random seed (42), and model features are standardized using z-score normalization, where the mean and standard deviation were computed on the training split and then applied to both training and test splits to avoid data leakage:
𝑥𝑛𝑜𝑟𝑚 = (𝑥 − 𝜇𝑡𝑟𝑎𝑖𝑛)/𝜎𝑡𝑟𝑎𝑖𝑛
Training uses fixed settings (1,000 iterations; learning rate 0.1; weights initialized to zero), and the model applies a fixed 0.5 decision threshold.
Evaluation outputs include accuracy, precision, recall, F1, per-class metrics, and a confusion matrix. NexLAB also reports an association ranking—the absolute Pearson correlation between each feature and the encoded label—to help learners interpret patterns; this is a univariate association, not a causal or model-based attribution. Key reproducibility settings are visible in the Data Analysis interface and saved with each run (Figure 4).
Regression (Multivariate Linear Regression and Cross-Validation)
NexLAB fits multivariate linear regression by ordinary least squares (OLS), reporting R², MSE, RMSE, and MAE on both train and test splits. To estimate generalization beyond a single split, it optionally runs K-fold cross-validation (K = 3, 5, or 10), reporting the mean and standard deviation of R² across folds along with per-fold scores. The OLS choice prioritizes interpretability and transparency over predictive optimization, consistent with the platform’s instructional focus (see Methodological Constraints).
DBT-Aligned Student Activity Protocol and Reproducibility Controls
Student work in NexLAB follows the Design–Build–Test cycle introduced above in the worked course example, mirroring applied scientific analysis [11],[12]. Its methodological contribution is auditability: because the platform saves every analysis configuration with its results, an instructor can review how a student arrived at an outcome and can supply or lock specific settings so that comparisons remain consistent across a class while students still document their own iteration in the ELN.
Methodological Constraints (Pedagogical by Design)
NexLAB’s analysis tools are designed to keep model behavior transparent and interpretable for learners rather than to maximize predictive performance. This rationale motivates the choices described above: interpretable linear models, association rankings in place of more complex attribution methods, and evaluation artifacts that foreground interpretation (confusion matrices, cross-validation summaries). For the same reason, several classification hyperparameters are fixed (1,000 iterations; learning rate 0.1; decision threshold 0.5), holding model behavior constant so that students compare data representations and evaluation outcomes rather than tuning parameters.
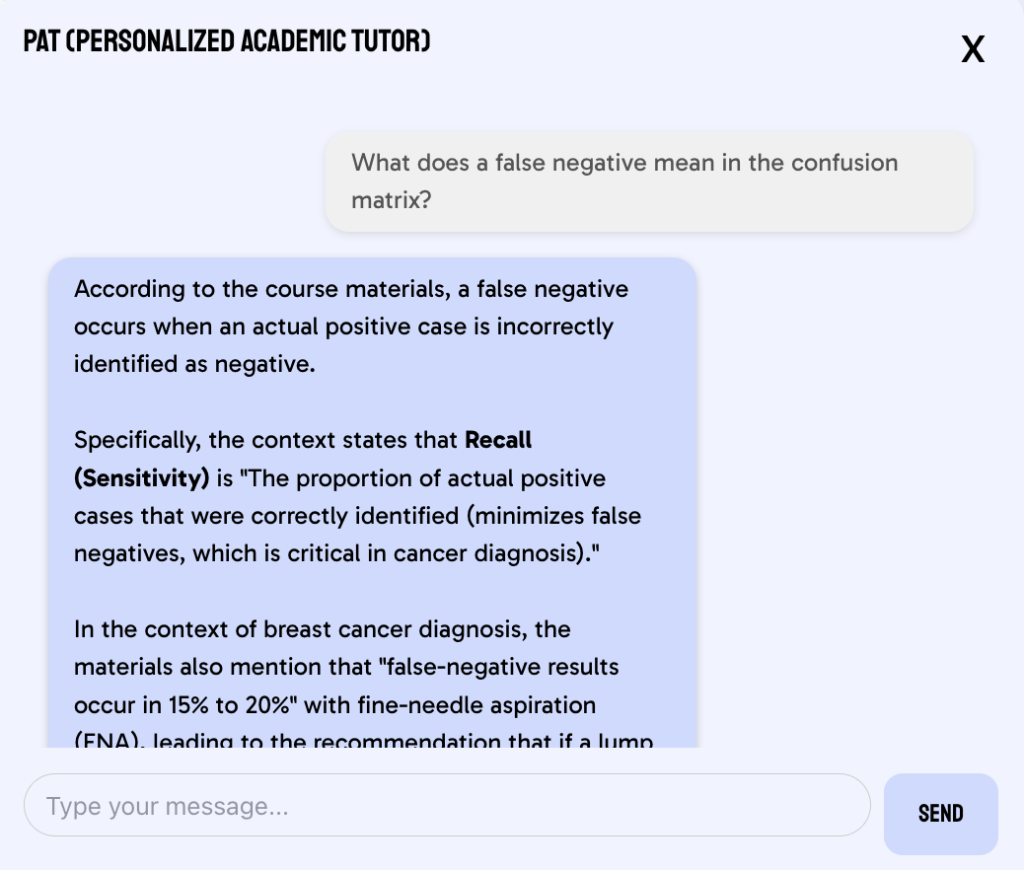
AI Tutor Grounding and Scope Constraints The AI tutor is available in both the ELN and the Data Analysis interface and is trained only on the course materials an instructor authors in NexLAB, so its explanations stay within the same terminology and scope as the course. It provides real-time clarification of course concepts and definitions (e.g., precision vs. recall, the meaning of R²) and helps students document and justify their analytic decisions in the ELN; it does not provide clinical guidance. By design it reinforces instructor-led teaching and active learning rather than serving as a student’s first exposure to a concept. For example (Figure 5), when a learner asks what a false negative means in a confusion matrix, the tutor defines the error type and prompts the learner to interpret it in relation to malignant-class recall (sensitivity), consistent with the course’s definitions.
Results
Classification: Effect of Feature-Family Representation
All classification results were generated with NexLAB’s binary logistic regression tool (seed = 42). This produced 455 training cases and 114 test cases. The test set included 45 malignant and 69 benign instances. By using the same algorithm and the same split settings across runs, we could see noticeable differences between model performance, depending on which 10-feature family was used (Table 2). We present these outcomes as instructional contrasts under a fixed split/seed, not as claims that one feature family is universally best across datasets or modeling choices. Under this configuration, the worst-value feature family (C3) gave the strongest overall test performance, including the highest malignant-class recall, followed by the mean feature family (C1); the standard-error feature family (C2) performed substantially worse, with a sharp drop in malignant recall value.
Table 2. Logistic regression classification performance by feature family

Overall precision/recall/F1 are reported as support-weighted average values (as implemented in NexLAB), and model metrics are computed on the 114-sample test set.
To support interpretability in a way that is straightforward for learners, NexLAB reports a feature–target association ranking. Here, we interpret that ranking as the absolute Pearson correlation between each individual feature and the encoded diagnosis label. This is a univariate association measure; it does not represent model coefficients, multivariate importance, or causal effect. Across all three feature families, the highest-ranked associations consistently involved boundary irregularity and size-related morphology. For example, in the worst-value model (C3), concave_points_worst was the top-associated feature (|r| = 0.794), consistent with the idea that extreme morphology summaries carry strong discriminative signal in this dataset. Table 3 reports confusion matrices for each run. Even when overall accuracy appears strong, the confusion matrix shows clearly which errors dominate. In particular, C2 (SE-family) shows more malignant cases predicted as benign (false negatives), while C3 (worst-family) approaches highest performance with few misclassifications under the fixed split/seed.
Table 3. Confusion matrices for logistic regression classification by feature family
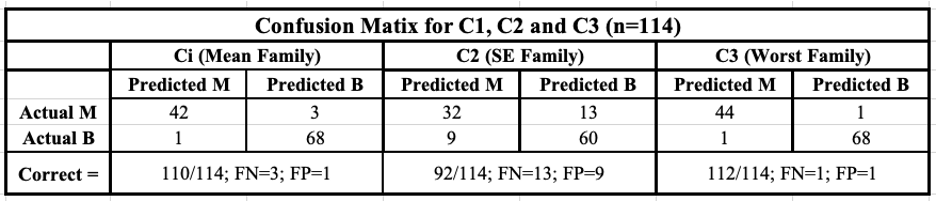
Under the same procedure (80/20 split; seed = 42), the SE-family model (C2) produces more false negatives and positives, whereas the worst-family model (C3) shows minimal errors.
Confusion matrices illustrate how feature-family representation changes error profiles under the same procedure (80/20 split; seed = 42). The SE-family model (C2) produces more false negatives and positives, whereas the worst-family model (C3) shows minimal errors.
Regression: Predicting area_worst and Cross-Validation Stability
Regression results were generated using NexLAB’s multivariate linear regression functionality as described above (train n = 455; test n = 114). We chose to run 5-fold cross-validation (K = 5) to provide a more stable model generalization estimate, training the models on four folds and evaluating on the remaining fold. Performance varied strongly across the three predictor sets (Table 4). Models containing size-based predictors such as radius_worst and perimeter_worst (R1 and R3) generalized well and showed consistent fold-to-fold performance, whereas the irregularity/texture-focused set (R2) generalized worse and varied more across folds—illustrating for learners that a single train/test split can overstate how well a model generalizes.
Table 4. Linear regression performance predicting area_worst (80/20 split; seed = 42; 5-fold CV)
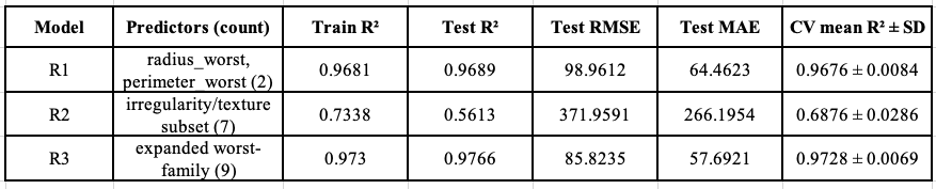
Figure 6 shows the learner-facing regression model outputs for the R3 configuration, including train/test metrics, an association-based ranking, and the cross-validation summary. The platform’s association ranking (absolute Pearson correlation with the target) highlighted radius_worst as the strongest correlate of area_worst (|r| = 0.984). This provides a straightforward interpretability cue for learners and supports discussion of redundancy and multicollinearity among geometric predictors.
Discussion
Integrated ELN–AI tutor–ML Workflow as Workforce-Aligned Practice
NexLAB is designed to support workforce-aligned biotechnology competencies by integrating course content, experiment documentation, and analytic decision-making into one workflow. In many toolchains, modeling and evaluation happen outside the learning environment and the reasoning behind key choices goes unrecorded; NexLAB instead places those steps inside ELN entries, prompting learners to justify decisions and interpret results. This is intended to make the analytic process visible and reviewable, so instructors can see not only final metrics but how students framed questions, chose metrics, and revised in response to results. Linking quantitative outputs to recorded decision-making mirrors quality-practice expectations in real laboratory and data-driven work. Within this workflow the AI tutor is intended to act as a tool for active learning, not a substitute for student reasoning: learners use it to clarify concepts, while the ELN requires that understanding to be stated as explicit claims, limitations, or next steps. By combining a course-grounded AI tutor with an ELN that can embed analysis when a course needs it, NexLAB addresses the fragmentation common in biotechnology education and training.
What the Embedded Outputs Show, and the Instructional Design They Suggest
Taken together, the results show why NexLAB emphasizes evaluation beyond accuracy, and they point to three instructional design requirements for an integrated ELN-and-analysis workflow. First, representation comparison should be explicit: because the classification runs differ only in feature representation (C1–C3), the resulting differences in malignant recall let students attribute changes in outcomes to how the data are represented rather than to the algorithm, giving them a concrete reason to read confusion matrices and class-specific metrics rather than headline accuracy. Second, evaluation should be framed as decision-making, not scoring: the malignant-recall drop in C2 shows how “acceptable” accuracy can mask costly errors, motivating ELN prompts that require justification—for example, which metric matters most for the analytic goal, and what tradeoff does it imply?—so students tie a rationale to context instead of reporting metrics as a checklist. Third, revision should be required and documented: the regression sequence (R1 → R2 → R3) shows that plausible feature sets can generalize inconsistently across folds, so a single split can mislead; this supports an iterative assignment in which learners begin with one predictor set, test it and revise, each step recorded as a DBT design decision. For teaching, the value lies less in any specific number than in the workflow that produced it—explicit, saved configurations that let instructors lock comparisons and motivate students to test changes in outcomes.
Limitations and Future Work
This manuscript is a workflow demonstration, not a controlled study of learning outcomes: it shows what NexLAB produces—confusion matrices, class-specific metrics, and cross-validation summaries—rather than measuring student gains. Future work should evaluate the platform’s classroom impact, including whether the DBT-structured ELN improves documentation quality, how students’ metric interpretation evolves, and how AI-tutor support affects reasoning. By design, NexLAB currently favors interpretable linear models and correlation-based association summaries, which suit introductory instruction but are explicitly non-causal. Planned development includes additional model families (e.g., tree-based classifiers), more robust feature-importance methods such as permutation importance, and an advanced-settings mode for adjusting fixed hyperparameters, enabling instruction on threshold sensitivity while preserving transparency. Accessibility is also a priority: comprehensive support for keyboard navigation, screen readers, and speech-to-text input has not yet been a formal focus and is planned work.
Conclusion
NexLAB integrates course materials, DBT-structured documentation, a course-grounded AI tutor, and optional embedded analysis to support workforce-aligned practices in biotechnology education. The worked example, using the BCWD dataset, shows how the platform turns analytics work into reproducible, interpretable outputs—confusion matrices, class-specific metrics, and cross-validation summaries—through explicit split and seed controls and saved configurations, and how feature representation and selection shape performance and error types. These capabilities create opportunities to teach evaluation, revision, and clear reporting. Because this manuscript reports what the platform produces rather than measured learning gains, future research should evaluate NexLAB in the classroom to assess its effects on student learning, documentation quality, and iterative decision-making.
Acknowledgements: This work was supported by the National Science Foundation (NSF) under award 2300976.
Disclosures: The authors declare no conflicts of interest.
[1] National Science Foundation, “Advanced Technological Education (ATE),” Program Solicitation NSF 21-598, 2021. [Online]. Available: https://nsf-gov-resources.nsf.gov/solicitations/pubs/2021/nsf21598/nsf21598.pdf Accessed: Jan. 31, 2026.
[2] M. K. Kjelvik and E. H. Schultheis, “Getting messy with authentic data: Exploring the potential of using data from scientific research to support student data literacy,” CBE—Life Sciences Education, vol. 18, no. 2, es2, Summer 2019, doi: 10.1187/cbe.18-02-0023.
[3] S. Freeman, S. L. Eddy, M. McDonough, M. K. Smith, N. Okoroafor, H. Jordt, and M. P. Wenderoth, “Active learning increases student performance in science, engineering, and mathematics,” Proc. Natl. Acad. Sci. U.S.A., vol. 111, no. 23, pp. 8410–8415, Jun. 2014, doi: 10.1073/pnas.1319030111.
[4] U. Dirnagl and S. Przesdzing, “A pocket guide to electronic laboratory notebooks in the academic life sciences,” F1000Research, vol. 5, 2016, doi: 10.12688/f1000research.7628.1.
[5] J. Vandendorpe, B. Adam, J. Wilbrandt, B. Lindstädt, and K. U. Förstner, “Ten simple rules for implementing electronic lab notebooks (ELNs),” PLOS Computational Biology, vol. 20, no. 6, e1012170, Jun. 2024, doi: 10.1371/journal.pcbi.1012170.
[6] S. G. Higgins, et al., “Considerations for implementing electronic laboratory notebooks in academically focused research groups,” 2022. [Online]. Available: https://pubmed.ncbi.nlm.nih.gov/35031789/
[7] J. A. Eblen-Zayas, “Comparison of electronic and traditional notebooks in an advanced physics lab,” AIP Conf. Proc., vol. 1655, 070003, 2015, doi: 10.1119/bfy.2015.pr.007.
[8] S. H. Chen, “Implementing an electronic laboratory notebook in a curriculum: A case study,” 2024. [Online]. Available: https://link.springer.com/article/10.1007/s11165-024-10242-0
[9] J. A. Kulik and J. D. Fletcher, “Effectiveness of intelligent tutoring systems: A meta-analytic review,” Rev. Educ. Res., vol. 86, no. 1, pp. 42–78, Mar. 2016.
[10] K. VanLehn, “The relative effectiveness of human tutoring, intelligent tutoring systems, and other tutoring systems,” Educational Psychologist, vol. 46, no. 4, pp. 197–221, 2011, doi: 10.1080/00461520.2011.611369.
[11] N. J. Hillson, et al., “Automating the design-build-test-learn cycle toward next-generation biomanufacturing,” New Biotechnology, 2023. [Online]. Available: https://pubmed.ncbi.nlm.nih.gov/37837820/
[12] N. Gurdo, D. C. Volke, D. McCloskey, and P. I. Nikel, “Automating the design-build-test-learn cycle towards next-generation bacterial cell factories,” N. Biotechnol., vol. 74, pp. 1–15, May 2023. doi: 10.1016/j.nbt.2023.01.002. [Online]. Available: https://pubmed.ncbi.nlm.nih.gov/36736693/.
[13] UCI Machine Learning Repository, “Breast Cancer Wisconsin (Diagnostic),” 1993, doi: 10.24432/C5DW2B. [Online]. Available: https://archive.ics.uci.edu/dataset/17/breast+cancer+wisconsin+diagnostic.
[14] Google Cloud, “Cloud Firestore documentation,” 2026. [Online]. Available: https://cloud.google.com/firestore.
[15] M. Holt, “Papa Parse: A powerful, in-browser CSV parser for JavaScript,” GitHub repository. [Online]. Available: https://github.com/mholt/PapaParse.